 It was widely reported this past week that Amazon acquired Graphiq, a company providing solutions for search and data visualization. Much of the coverage surrounding the acquisition focused on Graphiq’s semantic search tools. With Alexa’s notoriously poor showing in a head-to-head trivia contest against Google Home, it’s not surprising that Amazon is looking to beef up Alexa’s knowledge base.
Semantic Search Built Around Verticals
Graphiq started out as FindTheBest (FTB), founded by Kevin O’Conner. Two years ago, Greg Sterling wrote this article in Search Engine Land with insights into the technology underlying Graphiq’s capabilities. According Greg, Graphiq took a slightly different approach when it set out to build its knowledge graph. Focusing on specific verticals, the company designed data structures tailored to those industries and then loaded them with data from all possible publicly available sources.
Some of their offerings included sites that addressed specific “life events” that are enhanced with the help of an intelligent assistant, like finding a home, for comparing credit card rates, and for researching college rankings. The company’s structured knowledge graphs comprised more than a dozen such verticals; however those individual search sites are no longer available.
Is a Picture Worth a Thousand Words?
At some point, the team at Graphiq turned its focus to data visualization. Prior to the acquisition, Graphiq’s customers included top publishers such as the Los Angeles Times, Reuters, and the Associated Press.
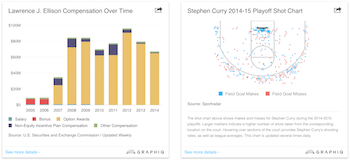
A recent blog post from Graphiq’s website illustrates several examples of news-related data visualizations. The graphical depictions of data showcased in the post include a map of Paris with geographic markers pinpointing where a gunman shot a police officer; an article about an apparently racially-motivated shooting in Fresno, CA is accompanied by a bar graph illustrating trending occurrences of hate crimes in the U.S.; and a discussion of Georgia primary results included an animated map of changing voter patterns over time.
Visual representations of news-related data capture the reader’s attention, while providing an added dimension to what might otherwise be an abstract news story. Pictures help people more easily relate to what they’re reading. But providing data visualizations is hard. First you need the underlying data structures that transform raw data into meaningful insights. Then you add in automated visualization tools to turn those insights into helpful pictures.
Intelligent Assistance Must Support all The Senses
We recently wrote about Amazon’s release of the Echo Show. Introducing a screen into what was a “voice-first” experience ups the ante for voice application designers. With its acquisition of Graphiq, Amazon has plugged Alexa into a vast new source of knowledge, and it has also given its assistant the ability to show rather than just tell. Time will tell, but we anticipate that the addition of visual information along with streamed video and audio content will serve to make the use of Amazon’s assistants more compelling across a number of devices, modalities and media.
Categories: Conversational Intelligence, Intelligent Assistants, Articles, Mobile + Location

 Opus Research Welcomes Ian Jacobs as VP and Lead Analyst
  United Airlines, TXU Energy, and Memorial Hermann Among Opus Research’s 2024 Conversational AI Award Winners
  Views from the NICE Analyst Summit: Introducing the Experience Continuum
  Opus Research Announces 2023 Conversational AI Award Winners